
The stock market makes its money at night. You still can't trade it.
A viral reel says Micron would have returned 138 million percent if you had bought every close and sold every open, and lost 99% the other way round. I checked it on 790 stocks in the US and the Nordics. The strange part is that the anomaly is real. The useful part is why it still won't make you money, and the one free thing it does give you.
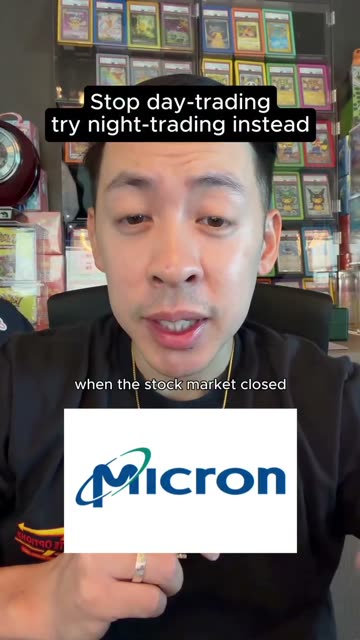
A reel with 700,000 views landed in my feed last week. The claim: if you had bought Micron every day at the close and sold it the next morning at the open, you would be up 138 million percent. Do the opposite, buy the open and sell the close, and you would be down 99 percent. Then the line that gets the shares: "Stop day-trading. Try night-trading instead."
It sounds like nonsense. It is also, as it turns out, mostly true. So I did what I always do with things that sound like nonsense and turn out to be true: I ran the numbers properly, and then I added the bill.
Short version: the stock market really does make almost all of its money while it is closed, and you still cannot trade it. The gap between those two sentences is the whole article.
The 138 million percent is three different numbers
Start with the headline. I pulled Micron's full daily history from 1984 and split every day into two legs: the overnight leg (yesterday's close to today's open) and the day leg (today's open to today's close). Compound each leg on its own.
My data says the overnight leg turned one dollar into about 3.8 million dollars. The reel says 1.4 million. Bruce Knuteson, the physicist who has spent a decade on this anomaly, gets 160,000 from his dataset. Same stock, same idea, three answers that differ by a factor of twenty.
That tells you what the number is made of. In the 1980s and 90s Micron traded in ticks of a sixteenth of a dollar on a share price of a few dollars. The "open" in old datasets is often just the first print of the day, which sits on the ask side after a night of small buy orders. Compounding that little bounce over ten thousand days gives you any number you like. Four percent of the old rows in my file have an open exactly equal to the close, which is not a market, it is a missing quote.
So the first lesson is the one I keep repeating on this site: a backtest that starts in 1984 is measuring the data as much as the market.
But here is what surprised me. Run Micron on clean data from 2015 onwards and the shape survives. Overnight leg: plus 5,000 percent. Day leg: minus 42 percent. Buy and hold: plus 2,900 percent. The number in the reel is silly. The direction is not.
The anomaly is real, and it is older than you
This is not a TikTok discovery. Kenneth French and Richard Roll wrote about it in 1986. Lou, Polk and Skouras published the version the reel is quoting in the Journal of Financial Economics in 2019, under the title A Tug of War. Elm Wealth has been writing about it for years. It is one of the best documented, least explained patterns in finance.
Take the S&P 500 itself, through the SPY fund, since 1993.
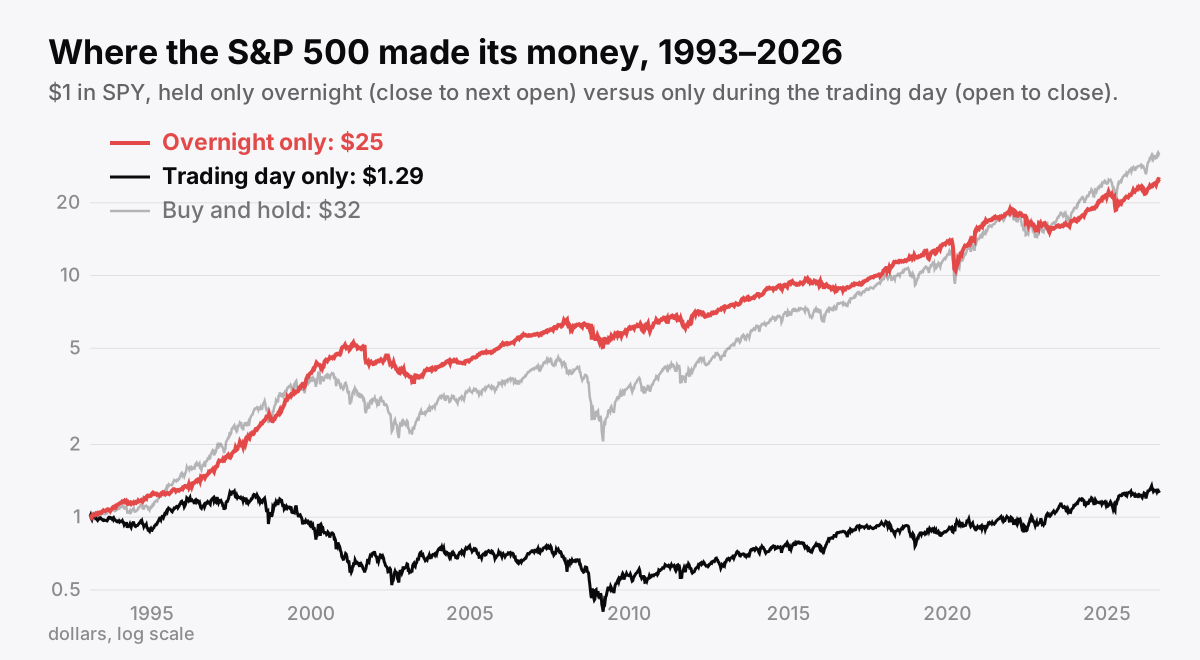
One dollar in SPY from 1993. Owned only overnight, it becomes about 25 dollars. Owned only during trading hours, it becomes 1.29 dollars. Buy and hold, which is simply both legs added together, ends at 32.
Thirty-three years. Ten percent a year while the exchange is closed. Under one percent a year while it is open. The trading day, the part with the screens, the news, the volume and the people, contributed almost nothing to the return of the world's most watched index.
The explanation the paper proposes is the one in the reel, and it is plausible: two crowds trade at two different times. Individuals put in orders in the evening and they execute at the open, into thin liquidity. Institutions do their business into the close, where the liquidity is. Retail buys the open, so the open is expensive. That pushes the return into the night and drains it from the day.
790 stocks, and where it actually lives
One index is an anecdote. So I ran the same split across the 790 stocks that the TradersVote scanner covers: the S&P 500, OMXS30, the Stockholm mid caps, Oslo, Copenhagen and Helsinki, from 2015 to today. As far as I can tell nobody has published this for the Nordic markets before.
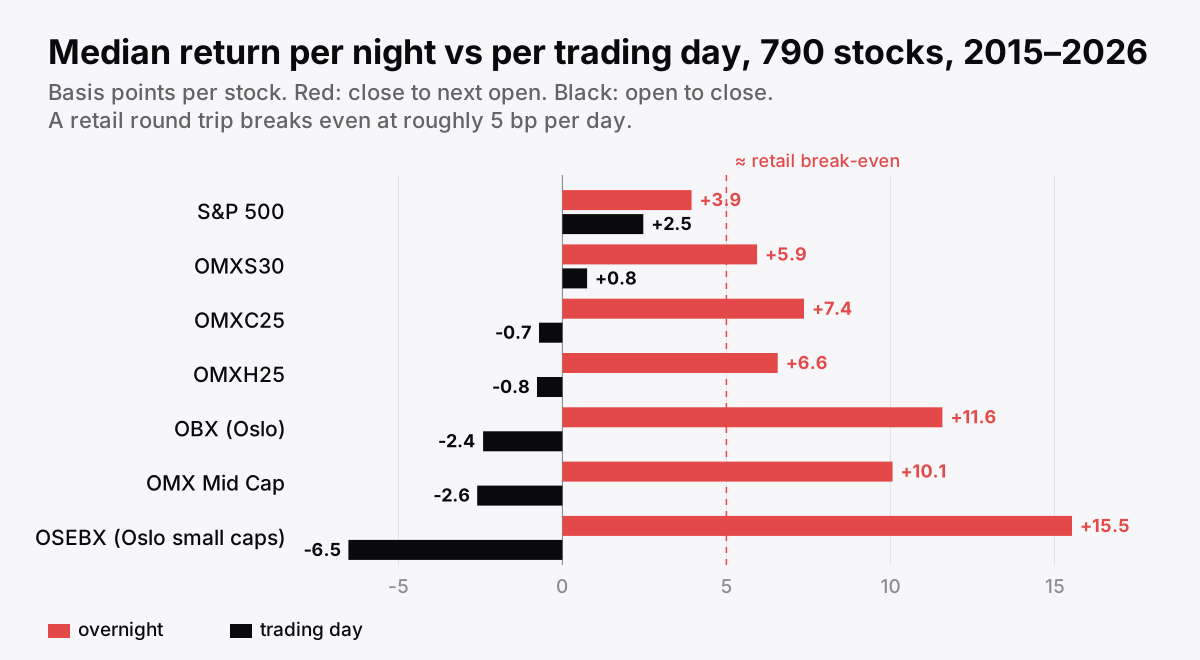
Median return per stock, in basis points. Red is the overnight leg, black the trading day. Every market is red-heavy. The Nordic small and mid caps are the striking ones: the trading day is negative.
In every single market the overnight leg beats the day leg for most stocks: 75 percent of S&P 500 names, 93 percent of OMXS30, 93 percent of Stockholm mid caps. That is the reel being right.
And then the Nordics do something the US does not. For the median Stockholm mid cap, the trading day is minus 2.6 basis points. Oslo small caps: minus 6.5. The average day trader in a Swedish small cap is, in aggregate, paying to be there. All of the return arrives overnight, and then some, because the day gives a bit of it back.
Now add the bill
Here is the part the reel skips. "Night trading" means buying at every close and selling at every open. That is two transactions a day, roughly 250 round trips a year. The overnight edge is 4 to 9 basis points per night for a large-cap stock. A basis point is a hundredth of a percent. So the question is not whether the edge exists. It is whether you can buy and sell for less than five basis points, every day, forever.
I compounded equal-weight baskets from 2015 with a round-trip cost of 0, 2, 5 and 10 basis points per day.
| Basket, 2015 to 2026 | 0 bp | 2 bp | 5 bp | 10 bp | Buy and hold |
|---|---|---|---|---|---|
| Ten US large caps | 21.9% | 15.9% | 7.4% | −5.3% | 33.2% |
| SPY, QQQ, IWM | 11.8% | 6.4% | −1.4% | −13.1% | 14.5% |
| Eleven Swedish large caps | 16.2% | 10.5% | 2.4% | −9.7% | 20.4% |
Annual return of the overnight-only strategy at different transaction costs, versus simply holding the same basket.
At zero cost the strategy looks wonderful. At five basis points per day it loses to buy and hold in every basket. At ten it loses to cash. Five basis points is the break-even, and five basis points is about what a professional pays for a round trip in a liquid US stock on a good day.
Now translate that to a Swedish retail account. On the entry-level commission class at a Swedish broker you pay roughly a quarter of a percent per side. That is 50 basis points a day, ten times the edge. Even on the cheapest class, at about seven basis points a side, you are paying fourteen to collect five. Add a currency fee on Norwegian stocks and it is over before it starts. An asset manager launched a fund to harvest this exact effect a few years ago. It closed within a year.
But what about the stocks where it works?
This is the question I actually wanted answered, because averages hide things. So I split the data: rank every stock by how strong its overnight edge was in 2015 to 2020, then look at what happened in 2021 to 2026, out of sample.
It persists, at the top. The best tenth of stocks by past overnight edge kept about half of it going forward, around 12 basis points a night, and two thirds of them beat buy and hold after a five point cost. Thirty-four stocks out of 740 beat buy and hold after a ten point cost in both halves. Thirty-two of them are Nordic small and mid caps. None are in the S&P 500. None are in OMXS30.
So it works on some stocks. Then I looked at which stocks. The median one trades for under one million dollars a day. Several trade for under 200,000. In an opening auction that size, your own order is the price. The edge in those names is not a mispricing waiting to be collected. It is the exact bounce that a thin auction gives to whoever is on the other side of a retail buy order, measured after the fact. Try to collect it and you become the retail buy order.
I also checked whether it was just earnings gaps, since Nordic companies report before the open. Removing the two percent biggest gap nights shaved the edge from 20 to 17 basis points. It is not the news. It is the liquidity.
What you can actually keep
The reel gets the diagnosis right and the cure wrong. You cannot night-trade your way out of a Swedish brokerage account. But there are two things worth taking with you.
Buy at the close, not at the open. This one is free. If you are going to buy a stock anyway, and especially a Nordic small or mid cap, the data says the open is the expensive part of the day and the close is the cheap part. Put your order in the closing auction. No extra trade, no extra cost, and you stop being the crowd that the paper is written about.
The return is in the holding, not the trading. Look at that SPY chart again. Overnight only: 25 dollars. Trading day only: 1.29. Both together, which is just owning it: 32. The person who bought once and did nothing collected both legs, paid one commission, and beat every version of the clever strategy, including the one with zero costs. Which is the same thing I found when I backtested buying the dip, and the same thing I will probably find next time.
Almost all of the market's return happens while you are asleep. The best trade is the one that lets you stay that way.
The reel that started this. It has the diagnosis right, so it is worth 45 seconds:
Method, code and the full per-stock results live in my Second Brain under TradersVote research. Data is daily open and close from Yahoo Finance, split and dividend adjusted on both legs, days with a missing open removed. None of this is advice; it is a measurement.