
We backtested "buy the dip" on 538 trending stocks. It lost to buying every month.
Everyone has the same plan — wait for Coca-Cola or Apple to drop 30%, then strike. I measured 20 years of dips on 538 trending stocks across 13 markets. The dip buyer ended with a median 86% of what the boring monthly buyer got. Here are the numbers, and the one thing dip buying actually is good for.
Everyone has this plan. Find a stock that has gone up for decades — Coca-Cola, Microsoft, Apple — and don't buy it now. Wait. Wait for one of those big, scary drops it makes every few years, and buy then. Get the discount everyone else panics through. It feels obviously right, so I did what I always do with things that feel obviously right: I backtested it properly.
Short version: it loses to just buying every month. Not by a little on a bad stock — as a median outcome across 538 trending stocks on 13 markets, over 20 years of data. But the way it loses is genuinely interesting, and there's one thing the dip plan turns out to be very good at. Let's go through it.
Step one: what does a "big dip" even look like?
First I needed the dips to be measurable instead of eyeballed. The definition: take the running high of the stock. Every time price falls off a high, a dip episode starts, and it ends only when that high is reclaimed. The depth of the episode is the distance from the high to the lowest low in between. That's it — no indicators, no opinions.
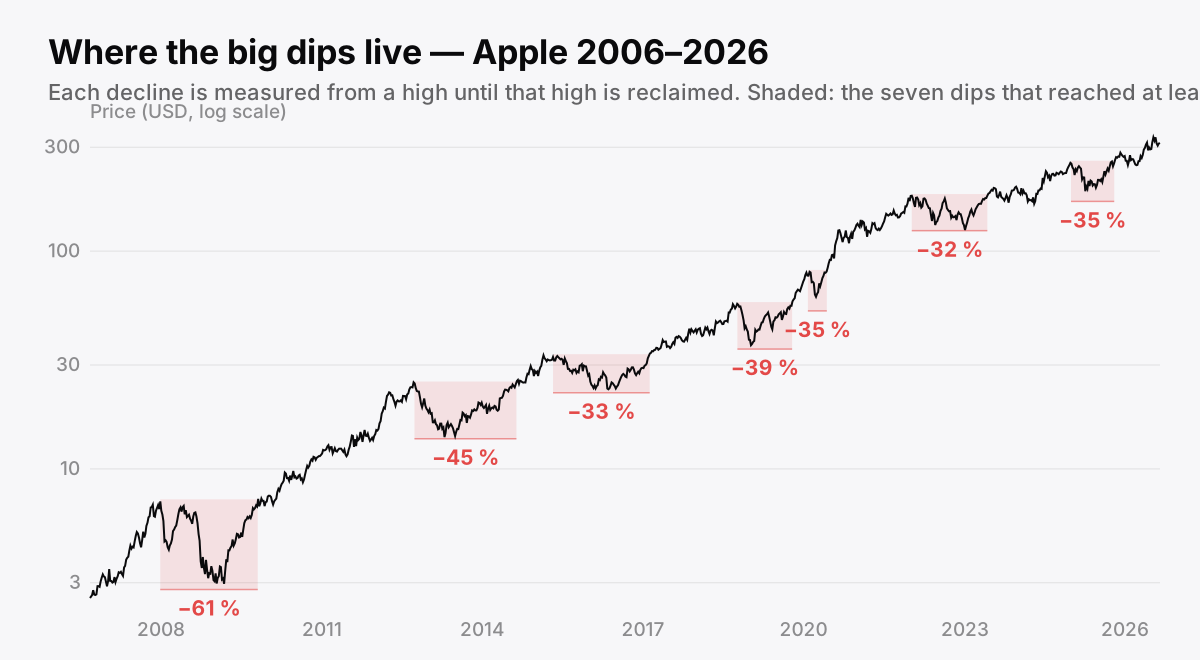
Twenty years of Apple. Every shaded box is one dip episode: from a high, down to the bottom, until the old high is reclaimed. The seven big ones: −61%, −45%, −39%, −35%, −35%, −33%, −32%.
Run that over Apple and you get exactly the picture you'd draw by hand on a chart: −61% in 2008, −45% in 2012–2014, −39% in 2018, around −33% several times since. Every stock has its own "characteristic big dip" — for Apple the typical major dip is in the low thirties. That number is real, it's stable, and it's computable. So far the idea holds up.
Step two: what counts as a "trending" stock?
The plan only makes sense on stocks that reliably recover, so I needed a mechanical trend filter too — no cheating by picking winners after the fact. The rule: a stock qualifies when its 50-day moving average has been above its 200-day moving average for at least 70% of the trading days over the previous three years, with at least five years of price history. That's "has spent most of the last three years in an uptrend," measured strictly with information available at the time — the filter is re-evaluated as history unfolds, never with hindsight.
Out of ~800 stocks in my US + Nordic universe, 432 qualified long enough to be measured (at least five years of simulation after the rules could first fire). I then repeated everything on a second, completely untouched set — 216 large caps from the UK, Germany, France, Switzerland, the Netherlands, Japan, Canada and Australia — of which 106 qualified. In total: 538 qualified stocks, 13 markets, none of it hand-picked.
Step three: the fairest possible race
Imagine a saver who deposits one unit of money every month for 20 years. Three plans, identical deposits, so the final values are directly comparable:
- Buy every month. Every deposit is invested immediately. Never sells. This is boring old dollar-cost averaging — buy and hold with a monthly paycheck.
- Buy only the dips. Hoards cash and waits. When the stock falls to its own typical big-dip depth (the median of its historical dips of 20%+), a third of the cash pile goes in. At the deeper 70th-percentile level, half the rest. At the 90th percentile — a depth this stock has almost never reached — everything. Never sells. The dip levels come from each stock's own history, recomputed as time passes.
- Buy dips, sell highs. Same dip buying, but sells everything once the old high is reclaimed, then waits for the next dip with the whole pot — sale proceeds plus every monthly deposit since.
Here's what that looks like on Apple:
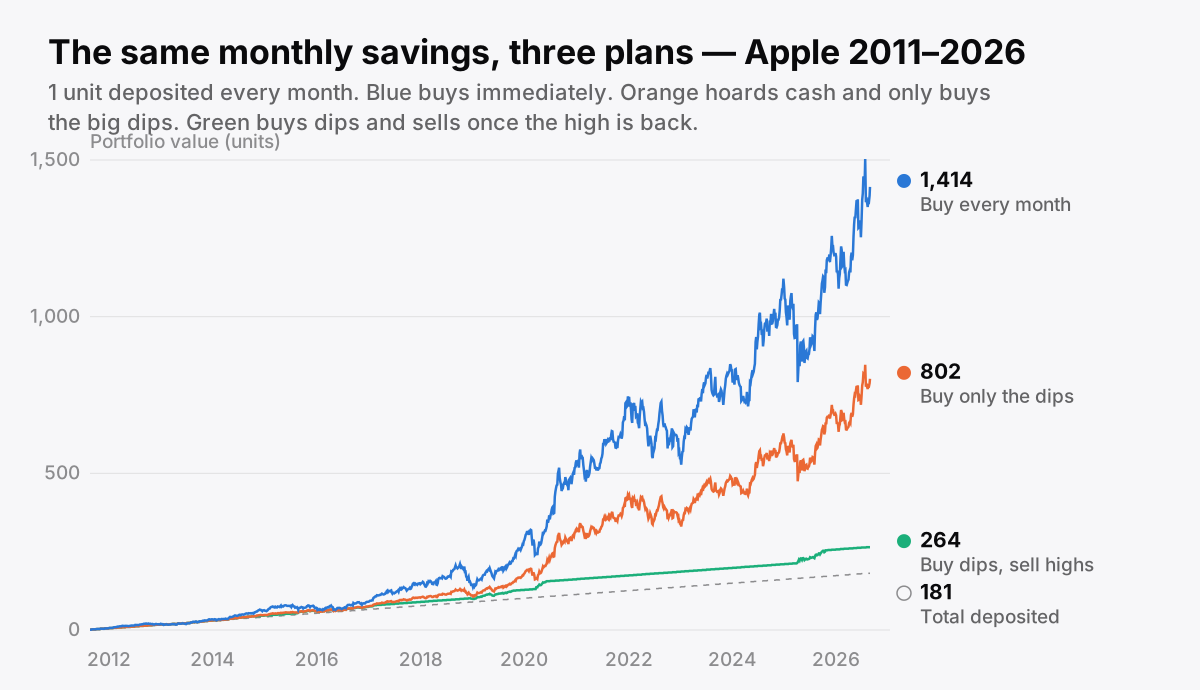
Same deposits, 181 units in total. The monthly buyer ends with 1,414. The dip buyer — who got every single crash at a discount — ends with 802. The one who also sold at the highs ends with 264.
The dip buyer bought the 2020 crash. Bought the 2022 bear market. Got every discount the plan promised. And still finished with 57% of the boring plan's money, because between the gifts there were years of compounding that the cash pile sat out.
The full results
Apple isn't a cherry-pick — it's the median story told dramatically. Across all 432 qualified stocks in the main universe:
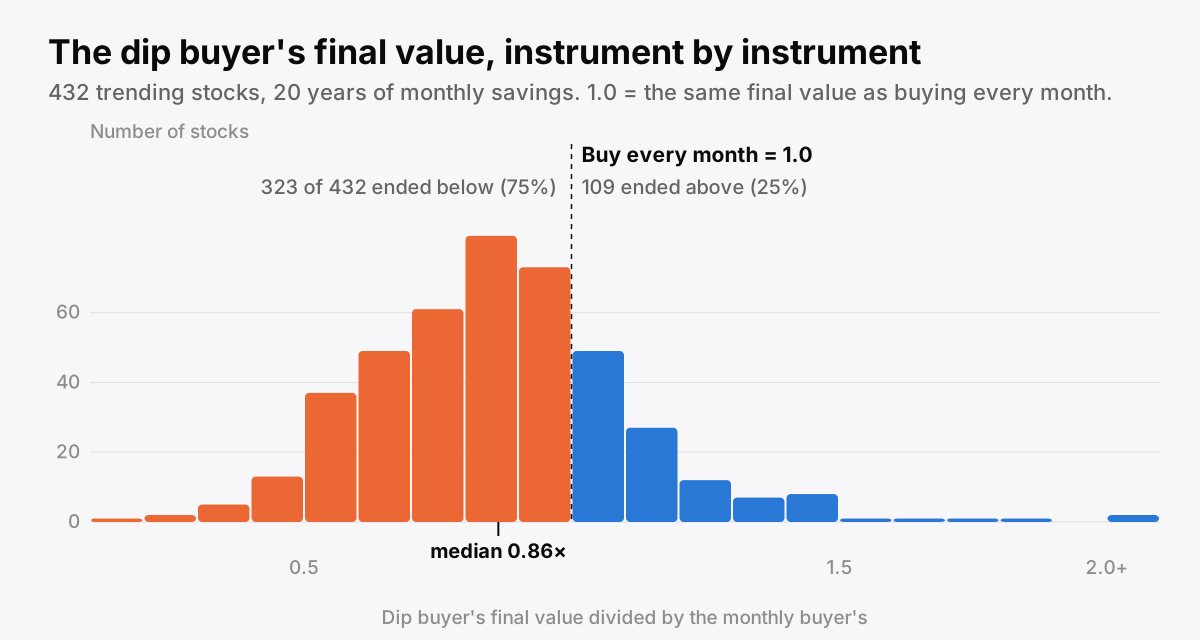
Each stock is one outcome: the dip buyer's final value divided by the monthly buyer's. Median 0.86×. To the right of the dashed line, the dip buyer won — 109 stocks out of 432.
- Median outcome: 0.86× — the dip buyer ends with 86% of the monthly buyer's money.
- The dip buyer won on 109 of 432 stocks (25%).
- On the fresh validation set (106 stocks, eight other markets): 0.94×. If the waiting cash earns 3% interest, that set reaches a dead heat — 1.01× — while the main set still loses at 0.93×.
- Selling at the highs made everything worse: 0.74–0.90× depending on market. On a real compounder, every "sell at the recovery" steps you out right before the years that make all the money. On Apple that plan turned 181 units into 264 instead of 1,414.
- I also tried going all-in at the first dip level instead of splitting into tranches: 0.88×. And triggering on smaller, more frequent dips: 0.88×, winning only 13% of the time. It's not the tranching, the trigger depth, or the selling — it's the waiting itself. Every rule that holds cash for a discount landed at 0.85–1.0× of just buying.
Two honesty notes. First, my universe is today's stock lists, which means survivorship bias — these are the stocks that made it. That inflates both plans equally, so the comparison between them stands, but don't read the absolute returns as a promise. Second, the data is price-only, without dividends — and that actually flatters the dip plan, because the monthly buyer holds more shares for longer and would collect more dividends.
Why the obviously-right idea is wrong
The discount at the bottom is real. You really do get Apple 33% off. The problem is what the plan costs between discounts: on a stock that qualifies as a long-term trender, big dips arrive years apart, and all those years your deposits sit in cash while the stock compounds without you. The dip feels like a gift when it comes — but the missed compounding before it costs more than the discount recovers. And the cruelest part: the stronger the trend, the worse the trade-off. The plan fails hardest on exactly the stocks it was designed for. It only roughly breaks even on choppier, sideways-ish markets — Germany and the UK in my test — which are precisely the ones nobody dreams about when they imagine this strategy.
The one thing dip buying is actually good for
There is one number where the dip plan wins everywhere: maximum drawdown. The monthly buyer's portfolio fell 47% from its peak at the median; the dip buyer's fell 29%. Nearly half the pain. That's mechanical — a plan that's partly in cash most of the time swings less, and its buys happen at low prices by construction.
So the honest conclusion isn't "dip buying is stupid." It's a classification: buying the dip is a risk reducer, not a return enhancer. If a halved drawdown is what keeps you from panic-selling at the bottom — the mistake that actually destroys savers — a dip plan might be worth its cost to you. But if the question is "does waiting for the big dip beat just buying every month?", the answer across 538 trending stocks and 20 years is no. Three times out of four, the boring plan wins, and the median cost of being clever was 14% of your final wealth.
Buy every month. Let the dips come to you — you'll be buying through them anyway.
Why I run tests like this at all
Insights like this are exactly why I built TradersVote. I've run hundreds of analyses like this one, and the pattern repeats: ideas that feel obviously right rarely survive honest measurement — and the few that do are worth everything. TradersVote exists so you don't have to run thousands of backtests yourself. It scans the markets every night and sends clear signals — what to buy, in what entry zone, with the stop and target set from the start — and every signal is graded openly against what the market actually did, losses included.
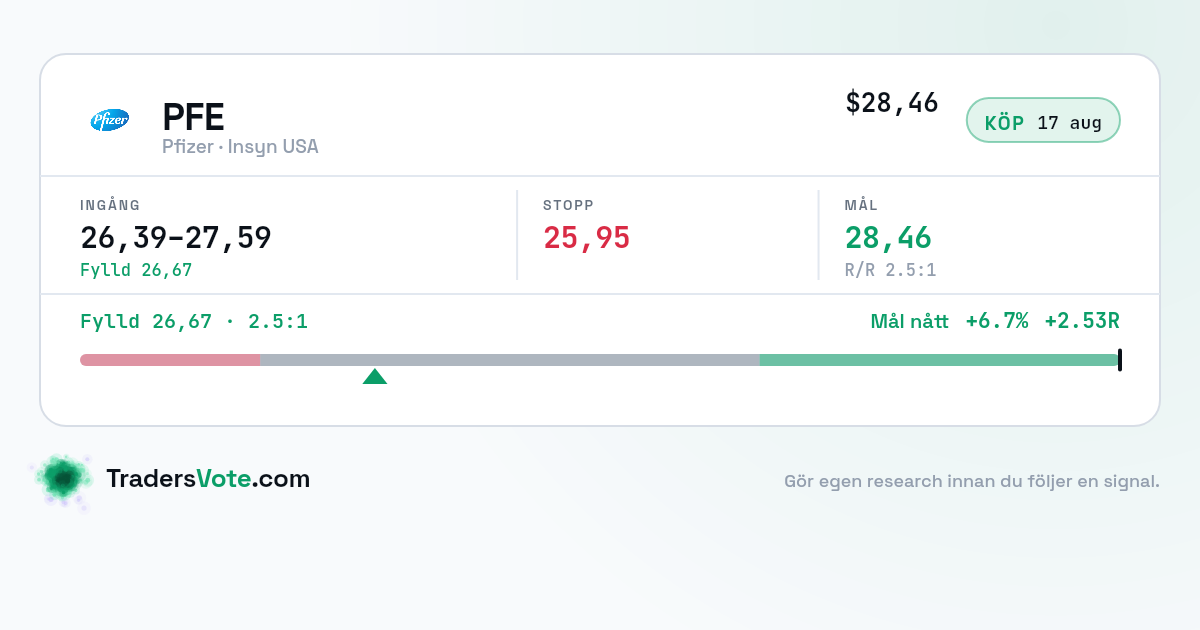
A real TradersVote signal: Pfizer, flagged by the US insider-cluster strategy on August 17. Entry zone, stop and target were set from the start — the target was hit eight days later for +2.53R. (The card comes straight from the product, which speaks Swedish: "Fylld" = filled, "Mål nått" = target reached.)
Check it out at tradersvote.com.